Research Article | | Peer-Reviewed

An Analysis of Product Flow Along the Fertilizer Value Chain in Kaduna State

Received: 23 June 2026     Accepted: 3 July 2026     Published: 24 July 2026
Views:       Downloads:
Abstract

The study was carried out in Kaduna State to analyse the product flow of the various actors along the fertilizer value chain in 2021. Structured questionnaires were used to collect data for the study from the fertilizer value chain actors. Power analysis was used to arrive at the sample size for farmers with an actual power point of 0.95 and 0.99 respectively for retailers and farmers. Other actors were selected through different sampling methods are blenders, transporters and retailers. Exploratory Factor Analysis (EFA) revealed that efficient product flow in the chain has enabled stakeholders to reduce the cost of operations significantly. Notably, a substantial percentage of agro-dealers (74 per cent), blenders (83 per cent), retailers (100 per cent), and wholesalers (48 per cent) acknowledged this tangible benefit. This implies that optimized product flow streamlines the movement of fertilizer products from suppliers to retailers and end-users, minimizing delays and related costs. It also revealed that Agro-dealers (100 per cent), blenders (74 per cent), retailers (72 per cent), and wholesalers (37 per cent) recognized increased business earnings as one of the most significant tangible benefits in the chain. A well-organized product flow leads to increased sales and revenue generation. Under product flow, seven items that were loaded on the first factor to explain the variance 55% included such statements as reduced cost of production, increased profit, increase returns on investments, reduced waste, avoid over production, and improved timeliness of product movement with alpha value of 0.96, the result implied that the measurement scale is a good indicator of the underlying construct.

Published in International Journal of Agricultural Economics (Volume 11, Issue 4)
DOI 10.11648/j.ijae.20261104.15
Page(s) 123-130
Creative Commons

This is an Open Access article, distributed under the terms of the Creative Commons Attribution 4.0 International License (http://creativecommons.org/licenses/by/4.0/), which permits unrestricted use, distribution and reproduction in any medium or format, provided the original work is properly cited.

Copyright

Copyright © The Author(s), 2026. Published by Science Publishing Group

Keywords

Fertilizer Value Chain, Product Flow, Crossloading, Construct, Communality, Mehalanobis Distance, Varimax Rotation

1. Introduction
Fertilizer value chain describes the activities involved in the production of fertilizers right from the raw material stage and the transformation it goes through with value addition at every stage until it reaches the final consumer. According to United Nation Industrial Development Organization , a value chain describes the entire range of activities undertaken to bring a product from the initial input-supply stage, through various phases of processing, to its final destination, and it includes its disposal after use . Value chains include all of the vertically linked, interdependent processes that generate value for the consumer, as well as horizontal linkages to other value chains that provide intermediate goods and services . Value chains focus on value creation typically via innovation in products or processes, as well as marketing and also on the allocation of the incremental value .
Agro-food value-chain encompass activities that take place at the farm or rural level, including input supply, production and continues through handling, processing, storage, packaging and distribution. As products move successively through the various stages, transactions take place between multiple chain stakeholders, money changes hands, information is exchanged and value is progressively added . A fertilizer value chain analysis therefore provides a deeper insight into the chain activities, its structure and functioning by depicting the various actors and their interactions along the value chain. In different stages of value chain, different stakeholders add value to the product to increase the end product value . In other words, a value-chain analysis looks at every step from raw materials to the eventual end user right down to disposing of the packaging after use. The goal is to deliver maximum value to the end user for the least possible total cost. There are a lot of inter-linkages between successive stages in the value chain. As markets develop, the value chains will become more complex with more competing channels both for inputs and outputs .
The inefficient production and distribution of fertilizers contribute to high prices and limit access to fertilizers. Fertilizer production requires significant capital investments, which are often lacking in developing countries . Furthermore, the transportation and distribution of fertilizers are often inefficient, resulting in high transport costs and further increasing fertilizer prices . The lack of efficient logistics and distribution systems hinders the availability and affordability of fertilizers, particularly in remote and rural areas.
According to Food and Agriculture Organization , inadequate infrastructure is another challenge facing the fertilizer value chain. The lack of proper storage facilities and transportation networks contribute to fertilizer losses and increased costs . The absence of adequate storage facilities results in fertilizer losses through moisture, pests, and theft. Additionally, the lack of proper transportation networks hinders the efficient distribution of fertilizers, particularly in remote areas. The absence of efficient transportation networks limits access to fertilizers and increases transportation costs, further contributing to high fertilizer prices .
The fertilizer value chain starts with the manufacturing company to the final end users, and that is the rural farmers. Fertilizer in Nigeria is imported from other countries mostly through shipment. According to United Nations Industrial Development Organisation , a value chain describes the entire range of activities undertaken to bring a product from the initial input-supply stage, through various phases of processing, to its final destination, and it includes its disposal after use. Value chain is defined as the full range of activities which are required to bring a product or service from conception, through the different phases of production (involving a combination of physical transformation of the input of various producer services), delivery to final consumers, and final disposal after use .
Source: Adapted from
As asserted by Prahinski and Kacabasoglu , there are uncertain times for all involved in the fertilizer value chain: suppliers, importers, distributors, dealers, farmers and public officials have been exposed to great uncertainty and risk in fertilizer supply, demand and prices. During 2007-09 prices of such major fertilizer products as urea, DAP and Muriate of Potash quadrupled within a nine-month time frame; and then, in the case of nitrogen and phosphorous fertilizers, declined just as quickly and by almost the same magnitude . Numerous factors contributed to the volatility – global food security threats, the bio-fuel “hysteria” in North America, and disruptions in fertilizer production in some markets, export restrictions by some key exporters to assure their own domestic fertilizer supply requirements and the continued credit market disruptions and instability .
According to Lasorn et al. , the external market environment had a direct and compelling impact upon all involved in the fertilizer value chain. Assurance of fertilizer supply on a timely basis, cost containment to minimize the high costs of fertilizers in times of rapidly escalating/declining prices, and improving farmer access to fertilizers not only to improve food security but also to allow for acceptable financial returns to farmers using fertilizers have impacted decision-making at all levels . Policy makers, fertilizer suppliers, importers, distributors, dealers and farmers (as well as those providing logistics and financial services) face great risks associated with decision-making in fertilizer supply management. Servicing farmers’ needs is critical to agriculture sector performance. At no time in recent history has there been a greater challenge in improving farmer access to fertilizers. At the level of fertilizer policy, “smart subsidies” have been popular in some of the most vulnerable markets. One issue is how best to improve smallholder farmers’ access to fertilizers and at the same time preserve market-based fertilizer supply systems .
2. Objective of the Study
The object of the paper is to determine how competitive the value chain actors are in terms of product flow in Kaduna State.
3. Methodology
3.1. The Study Area
The study area is Kaduna State, Nigeria. The State lies between Latitude 09°02' and 11°32' North and Longitude 96°15' and 08°60' East of the Greenwich meridian. The state occupies about 46,016 Km2 which represent about 5% of the Nigerian land mass of 923,768 square kilometers in the central region of Nigeria. Kaduna State is made up of 23 Local Government Areas (LGAs) with a population of 6,133,503 people in 2006 . The projected population of the state at 3.2%t growth rate is put at 9,837,937 people as at 2021 projections. The soil type in the state consists of red-brown to red-yellow ferruginous tropical soils which are heavily weathered and markedly laterized. They are mostly formed on granite and gneiss parent materials, and on aeolian and many sedimentary deposits. The whole state is covered by the tropical grassland vegetation with the density of trees and other plants decreasing as one move northwards . 97.3% of the farmers in the state use fertilizer for farming which are mostly inorganic/mineral fertilizer but 43.1% use both organic and inorganic .
3.2. Statistical Tool
Exploratory Factor Analysis was used as a tool to determine their competitiveness through the equation modeled below; this is to reveal variations and covariations among the observed variables;
y (j = 1 to p) is factors’ function η (k = 1 to m) while, Residual ε. (j = 1 to p) for ith respondent,
Yij= Vj+ λj1ηi1+ λj2ηi2++ λjkηik+λjmηim+ εij(1)
Whereas,
Yi1= Factor component warehousing all the factors, Vj designates constant, λjk denotes factor loading, ηik denotes factor values and εij specifies residual mean values zero and relationships with factor is zero. Hence, the following model is derived in the forms of matrix;
Yi1= v+ Λ.η1+ εi(2)
Hereafter, V denotes as vector of intercept vj, ʹrepresents as factor loading matrix λpk, ψ denotes as factor variances/covariance matrix and, residual variances/covariance matrix represents by Θ.
While, Σ denotes matrix of covariance of observed variables with population and,
=Λ.ψ.Λ'+ (3)
Where: Λ represent pattern of factor, Λ.*Ψ denotes correlation between factors and items of factor structure and Θjj < 0 represents Heywood’s case, ηI denote scores of factors.
The indicators in factor analysis are measured using KMO recommended criteria of 0.5 as minimum, values less than 0.5 are not considered. The KMO measures the sample adequacy (which determines if the response given with the sample are adequate or not) which should be close than 0.5 for a satisfactory factor analysis to proceed.
4. Results and Discussions
Product Flow of Various Actors in the Fertilizer Value Chain
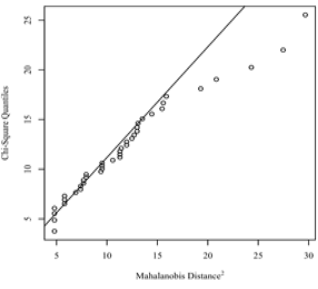
Exploratory factor analysis (EFA) was conducted for 12 variables using the Kaiser criterion for determining the number of factors to retain with varimax rotation for the product flow for agro-dealers, blenders, retailers and wholesale. To assess the assumption of multivariate normality, the squared Mahalanobis distances were calculated for the data and plotted against the quantiles of a Chi-square distribution for the four (agro-dealers, blenders, retailers and wholesale) and the scatterplot for normality is presented in Figures 2, 3, 4, and 5. All variables had at least one correlation coefficient greater than .30 and appear suitable for factor analysis for the entire stakeholder.
Figure 2. Product flow for Agro-dealers.
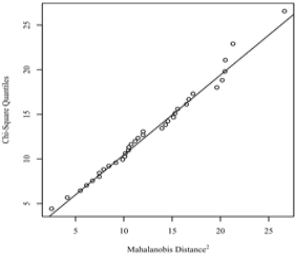
Figure 3. Product flow for Blender.
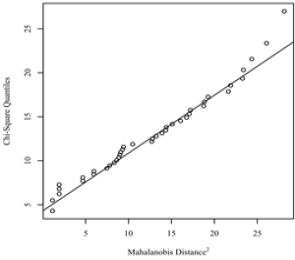
Figure 4. Product flow for Retailer.
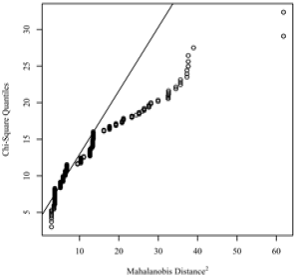
Figure 5. Product flow for Wholesaler.
Additionally, the determinant of the correlation matrix was calculated and the value of the determinant for the correlation matrix was 0.0001, indicating that there is no multicollinearity in the data for blender, retailer and wholesaler while the value of the determinant for the correlation matrix in agro-dealer was ≤ 0.00001, indicating that there is multicollinearity in the data and the model results may be unreliable. This multicollinearity in agro-dealer stakeholder has been corrected using variance inflation factor (VIF).
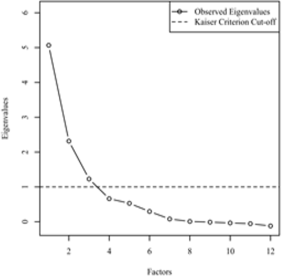
The Kaiser criterion was chosen for electing how many factors to retain. According to this rule, all factors that have an eigenvalue greater than one are retained for interpretation. Figures 6, 7, 8 and 9 shows the scree plot along with the Kaiser criterion for determining the number of significant factors. Looking at Figures 6, 7, 8 and 9, there were three, two, two and two factors that had an eigenvalue greater than one. As a result, three, two, two and two factors were used for the EFA.
Figure 6. Product flow for factors retained for Agro-dealer.
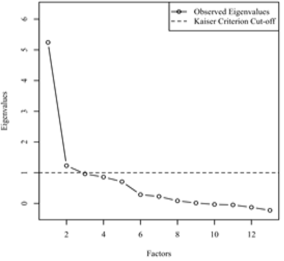
Figure 7. Product flow for factors retained for Blender.
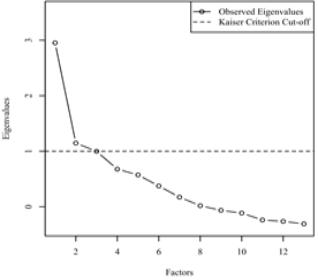
Figure 8. Product flow for factors retained for Retailer.
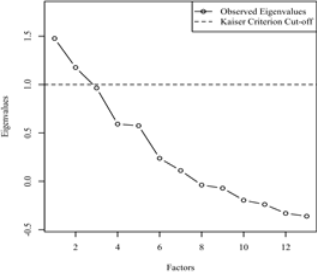
Figure 9. Product flow for factors retained for Wholesaler.

Agro-dealer: Factor 1 accounted for 39.54% of variance with an eigenvalue of 4.74. Factor 2 accounted for 15.95% of variance with an eigenvalue of 1.91. Factor 3 accounted for 14.74% of variance with an eigenvalue of 1.77. The total variance that can be explained by the three-factor model for agro-dealer accounted for 70.23%, indicating that 70.23% of the competitiveness for agro-dealers in terms of product flow can be explained by these three-factors. The factor analysis summary is shown in Figure 6. A Chi-square goodness of fit test was conducted to determine if the three-factor model fit the data perfectly based on an alpha value of .05, χ2(33) = 124.02, p <.001. This indicates that the three-factor model adequately depict the data.
Blenders: Factor 1 accounted for 22.77% of variance with an eigenvalue of 2.96. Factor 2 accounted for 22.33% of variance with an eigenvalue of 2.90. The total variance that can be explained by the two-factor model blenders accounted for 45.10%, indicating that 45.10% of the competitiveness for blenders in terms of product flow can be explained by these two-factors. The factor analysis summary is shown in Figure 7. A Chi-square goodness of fit test was conducted to determine if the two-factor model fit the data perfectly based on an alpha value of .05, χ2(53) = 110.22, p <.001. This indicates that the two-factor model adequately depict the data.
Retailers: Factor 1 accounted for 20.50% of variance with an eigenvalue of 2.67. Factor 2 accounted for 11.75% of variance with an eigenvalue of 1.53. The total variance that can be explained by the two-factor model for retailers accounted for 32.25%, indicating that 32.25% of the competitiveness for retailers in terms of product flow can be explained by these two-factors. The factor analysis summary is shown in Figure 8. A Chi-square goodness of fit test was conducted to determine if the two-factor model fit the data perfectly based on an alpha value of .05, χ2(53) = 415.40, p <.001. This indicates that the two-factor model adequately depict the data.
Wholesaler: Factor 1 accounted for 11.03% of variance with an eigenvalue of 1.43. Factor 2 accounted for 9.72% of variance with an eigenvalue of 1.26. The total variance that can be explained by the two-factor model for wholesalers accounted for 20.75%, indicating that 20.75% of the competitiveness of wholesalers in terms of product flow can be explained by these two-factors. The factor analysis summary is shown in Figure 9. A Chi-square goodness of fit test was conducted to determine if the two-factor model fit the data perfectly based on an alpha value of .05, χ2(53) = 42.83, p =.840. This indicates that the two-factor model depicted the data well.
Under product flow, seven items that were loaded on the first factor to explain the variance 55% included such statements as reduced cost of production, increased profit, increase returns on investments, reduced waste, avoid over production, and improved timeliness of product movement (Table 1) With an alpha value of 0.96, the result implied that the measurement scale is a good indicator of the underlying construct . The second factor, intangible financial benefit with an explained variance of 57% contains four items and has alpha value of 0.58 (Table 1), which suggested that the statements used adequately explained the underlying construct. Since the reliability tests which were used to purify the measurements were above the conventional cut-off point of alpha coefficient of 0.5, it implied that the statements used to operationalize these two factors adequately measure the underlying constructs.
Examining the communality of each variable, checking for crossloadings across multiple factors, and inspecting the number of strong loadings for each factor are good ways to analyze the validity of the factor structure. Five variables have an excellent loading on agro-dealers and blenders. Suggest that these items operationalize the tangible financial benefits of product flow adequately. Retailer has three while wholesaler has two items with such statements as, information through the chain is reliable and accurate, information received is given similar interpretation by all users, repeatable, comparable across space and time, information received is relevant, understandable and actionable, information received is true and sufficient, information is used in strategic management. It can be concluded that these statements adequately reflect and measure the underlying constructs of both tangible and intangible financial benefit factors. The only item to identify distinctive activity in my client business operation that is potentially damaging to the environment with cumulative factor score of 0.75 and 0.66 for retailer and wholesaler respectively.
Table 1. Product Flow of Fertilizer Value Chain Actors.

Product flow on this chain has enable my client to

Agro-dealer

Blender

Retailer

Wholesaler

Tangible Benefit

Reduce cost of price on my business operation

0.74

0.83

1.00

-

Increase the business earned in my business

1.00

0.74

0.72

-

Improve the management of waste

0.96

-

-

-

Avoid our production on business enterprises associated with this chain

0.92

0.53

-

0.70

Avoid unnecessary storage of produce

1.00

-

-

-

Improve the timelines of the movement of the product within the chain

0.79

0.84

-

-

Improve m capacity to meet buyer’s orders for raw materials of required volume and quantity

0.84

1.00

-

-

Intangible Benefit

Identify every distinct activity in fertilizer business operation as potentially value adding and weather this value is actually added, necessary but known-value adding or unnecessary (wasteful)

0.55

-

-

-

Ensure business prompt response to changing buyer/customer’s need

0.62

1.00

-

-

Improve business capacity to respond to buyer/customer’s feedback information

0.68

0.71

0.89

0.75

Identify every distinct activity in business operation that promote potentially damaging to the environment

0.61

-

0.75

0.66

The results of the Exploratory Factor Analysis (EFA) offer valuable insights for each stakeholder group in the fertilizer value chain. Understanding the factors that influence product flow competitiveness allows stakeholders to focus on improving key aspects of their operations, thus optimizing their performance and overall efficiency within the value chain.
For agro-dealers, the EFA resulted in three factors explaining a total variance of 70.23 per cent in terms of product flow competitiveness. Blenders had two retained factors, accounting for 45.10 per cent of the variance. Retailers had two factors explaining 32.25 per cent of the variance, while wholesalers had two factors accounting for 20.75 per cent of the variance.
Efficient product flow in the chain has enabled stakeholders to reduce the cost of operations significantly. Notably, a substantial percentage of agro-dealers (74 per cent), blenders (83 per cent), retailers (100 per cent), and wholesalers (48 per cent) acknowledged this tangible benefit. This implies that optimized product flow streamlines the movement of fertilizer products from suppliers to retailers and end-users, minimizing delays and related costs .
The study also revealed that Agro-dealers (100 per cent), blenders (74 per cent), retailers (72 per cent), and wholesalers (37 per cent) recognized increased business earnings as one of the most significant tangible benefits in the chain. A well-organized product flow leads to increased sales and revenue generation. Moreover, faster product flow enables businesses to respond more effectively to market demands, capturing opportunities for increased sales and market share .
Furthermore, stakeholders in the fertilizer value chain acknowledged improved business capacity to respond to buyer/customer feedback. Agro-dealers (68 per cent), blenders (71 per cent), retailers (89 per cent), and wholesalers (75 per cent) agreed on this aspect. Smooth product flow ensures timely and accurate delivery of orders to customers, leading to higher levels of satisfaction and positive feedback. This valuable feedback loop helps businesses enhance their products and services, leading to increased customer loyalty and retention .
These findings have important implications for the fertilizer value chain stakeholders. By understanding the factors affecting product flow, stakeholders can enhance their operational efficiency and strategic decision-making. It allows them to optimize their inventory management, distribution processes, and supply chain coordination, leading to reduced stockouts, wastage, and overall operational costs .
The implications of this analysis are substantial for the fertilizer value chain stakeholders. By identifying the significant factors that contribute to the product flow for each stakeholder, actors can focus on improving key aspects of their operations that directly impact their efficiency and performance. This knowledge empowers stakeholders to streamline their product flow processes, enhance coordination with other actors in the chain, and optimize their supply chain operations.
Additionally, understanding the number of significant factors allows stakeholders to allocate resources more effectively. By focusing on the most critical factors that influence product flow, stakeholders can prioritize their efforts and investments to achieve maximum impact on their performance within the value chain. This strategic approach can lead to improved competitiveness, cost-effectiveness, and sustainability in the fertilizer value chain.
5. Conclusion and Recommendation
The result from the study revealed that factors that influenced product flow competitiveness allow stakeholders to focus on improving key aspect of their operations thus, optimizing their performances and overall efficiency within the fertilizer value chain (FVC). Efficient product flow in the FVC has enabled stakeholders to reduce their cost of operations significantly where agro-dealers 74%, blenders 83%, retailers 100% and wholesalers 48% acknowledged the tangible benefits. It was also revealed in the study that the actors recognized increased business earnings as one of their most significant tangible benefits in the chain. Additionally, the actors acknowledged improved business capacity to respond to buyers/customers’ feedback. It is therefore recommended that policy makers, regulators, financiers and critical stakeholders should understand the factors affecting product flow so that actors can enhance their operational efficiency and strategic decision making through their support as it will help them in optimizing their business activities and make is more profitable.
Abbreviations

EFA

Exploratory Factor Analysis

KMO

Kaiser-Meyer-Olkin

DAP

Diammonium Phosphate

UNIDO

United Nations Industrial Development Organization

VIF

Variance Inflation Factor

FVC

Fertilizer Value Chain

Author Contributions
Mohammed Maina: Conceptualization, Data curation, Resources, Methodology, Visualization, Writing – original draft
Aisha Simbiat Hussaini: Writing – review & editing
Abdulrahman Sanni: Formal Analysis, Visualization, Methodology, Data curation
Conflicts of Interest
The author declare no conflict of interest.
References
[1] Abaje, I. B. (2007). Introduction to Soils and Vegetation. Publisher, Kafanchan: Personal Touch Productions.
[2] Braglia, M., & Frosolini, M. (2014). Factors affecting supply chain management efficiency in cross-border outsourcing: supply chain management: An International Journal, 19(3), 358-376.
[3] Chopra, S., & Meindl, P. (2021). Supply Chain Management: Strategy, Planning, and Operation. Pearson Publication.
[4] ECA (Economic Commission for Africa). (2018). Africa Sustainable Development Report 2018: Towards a transformed and resilient continent. United Nations Economic Commission for Africa.
[5] FAO. (2019). Fertilizer Use by Crop in Nigeria. Food and Agriculture Organization of the United Nations.
[6] Feller, A., Shunk, D., & Callarman, T. (2006). Value Chains Versus Supply chains. Retrieved from Microsoft Word - 03-06ART-ValueChains-SupplyChains-Fellerl.doc
[7] Giannakis, M., & Bruggeman, A. (2017). An inventory of collaborative logistics practices and their effects on supply chain performance. International Journal of Production Economics, 183, 185-204.
[8] Gyau, A., & Spiller, A. (2008). Disaggregating consumer response: the case of fresh tomatoes in Germany. Journal of International Food & Agribusiness Marketing, 20(3-4), 5-28.
[9] Hellin, J., & Meijer, M. (2006). Guidelines for Value Chain Analysis. Retrieved from
[10] Kaduna State Agricultural Structure Survey (KASS), (2017). Kaduna State Agricultural Structure Survey.
[11] Keltchen, D. J. Jr., Rebarick, W., Hult, G. T. M., Meyer, D. (2008), Best value supply chain: a key competitive weapon for the 21st century, Business Horizons, 51: 235-43.
[12] Larson, P. D., Poist, R. F., & Halldorsson, A. (2007), Perspectives on logistics vs SCM: a survey of SCM professionals, Journal of Business Logistics, 28(1), 1-24.
[13] Maina. M. (2024). An Assessment of the Factors Influencing Farmers’ Access to Fertilizer Markets in Some Selected Local Government Areas in Kaduna State, Nigeria. International Journal of Agricultural Economics 2024, Vol. 9, No. 2, pp. 41-45.
[14] Nilo E. P., Cañete, D. C., & Simbulan, V. S. (2017). Organic fertilizer value chain opportunities and challenges in Cagayan Valley, Philippines. Journal of Advanced Agricultural Technologies. 4(2): 128-13.
[15] National Population Commission (2006). Nigeria’s National Census NPC, Abuja.
[16] Prahinski, C., & Kocabasoglu, C. (2006). Empirical research opportunities in reverse supply chains, Omega: The International Journal of Management Science, 34 (6), 519-532.
[17] UNIDO, (2009). Agro-Value Chain Analysis and Development. United Nations Industrial Development Organization.
[18] World Bank. (2019). Fertilizer market outlook. Washington, DC: World Bank. Retrieved from
Cite This Article
  • APA Style

    Maina, M., Hussaini, A. S., Sanni, A. (2026). An Analysis of Product Flow Along the Fertilizer Value Chain in Kaduna State. International Journal of Agricultural Economics, 11(4), 123-130. https://doi.org/10.11648/j.ijae.20261104.15

    Copy | Download

    ACS Style

    Maina, M.; Hussaini, A. S.; Sanni, A. An Analysis of Product Flow Along the Fertilizer Value Chain in Kaduna State. Int. J. Agric. Econ. 2026, 11(4), 123-130. doi: 10.11648/j.ijae.20261104.15

    Copy | Download

    AMA Style

    Maina M, Hussaini AS, Sanni A. An Analysis of Product Flow Along the Fertilizer Value Chain in Kaduna State. Int J Agric Econ. 2026;11(4):123-130. doi: 10.11648/j.ijae.20261104.15

    Copy | Download

  • @article{10.11648/j.ijae.20261104.15,
      author = {Mohammed Maina and Aisha Simbiat Hussaini and Abdulrahman Sanni},
      title = {An Analysis of Product Flow Along the Fertilizer Value Chain in Kaduna State},
      journal = {International Journal of Agricultural Economics},
      volume = {11},
      number = {4},
      pages = {123-130},
      doi = {10.11648/j.ijae.20261104.15},
      url = {https://doi.org/10.11648/j.ijae.20261104.15},
      eprint = {https://article.sciencepublishinggroup.com/pdf/10.11648.j.ijae.20261104.15},
      abstract = {The study was carried out in Kaduna State to analyse the product flow of the various actors along the fertilizer value chain in 2021. Structured questionnaires were used to collect data for the study from the fertilizer value chain actors. Power analysis was used to arrive at the sample size for farmers with an actual power point of 0.95 and 0.99 respectively for retailers and farmers. Other actors were selected through different sampling methods are blenders, transporters and retailers. Exploratory Factor Analysis (EFA) revealed that efficient product flow in the chain has enabled stakeholders to reduce the cost of operations significantly. Notably, a substantial percentage of agro-dealers (74 per cent), blenders (83 per cent), retailers (100 per cent), and wholesalers (48 per cent) acknowledged this tangible benefit. This implies that optimized product flow streamlines the movement of fertilizer products from suppliers to retailers and end-users, minimizing delays and related costs. It also revealed that Agro-dealers (100 per cent), blenders (74 per cent), retailers (72 per cent), and wholesalers (37 per cent) recognized increased business earnings as one of the most significant tangible benefits in the chain. A well-organized product flow leads to increased sales and revenue generation. Under product flow, seven items that were loaded on the first factor to explain the variance 55% included such statements as reduced cost of production, increased profit, increase returns on investments, reduced waste, avoid over production, and improved timeliness of product movement with alpha value of 0.96, the result implied that the measurement scale is a good indicator of the underlying construct.},
     year = {2026}
    }
    

    Copy | Download

  • TY  - JOUR
    T1  - An Analysis of Product Flow Along the Fertilizer Value Chain in Kaduna State
    AU  - Mohammed Maina
    AU  - Aisha Simbiat Hussaini
    AU  - Abdulrahman Sanni
    Y1  - 2026/07/24
    PY  - 2026
    N1  - https://doi.org/10.11648/j.ijae.20261104.15
    DO  - 10.11648/j.ijae.20261104.15
    T2  - International Journal of Agricultural Economics
    JF  - International Journal of Agricultural Economics
    JO  - International Journal of Agricultural Economics
    SP  - 123
    EP  - 130
    PB  - Science Publishing Group
    SN  - 2575-3843
    UR  - https://doi.org/10.11648/j.ijae.20261104.15
    AB  - The study was carried out in Kaduna State to analyse the product flow of the various actors along the fertilizer value chain in 2021. Structured questionnaires were used to collect data for the study from the fertilizer value chain actors. Power analysis was used to arrive at the sample size for farmers with an actual power point of 0.95 and 0.99 respectively for retailers and farmers. Other actors were selected through different sampling methods are blenders, transporters and retailers. Exploratory Factor Analysis (EFA) revealed that efficient product flow in the chain has enabled stakeholders to reduce the cost of operations significantly. Notably, a substantial percentage of agro-dealers (74 per cent), blenders (83 per cent), retailers (100 per cent), and wholesalers (48 per cent) acknowledged this tangible benefit. This implies that optimized product flow streamlines the movement of fertilizer products from suppliers to retailers and end-users, minimizing delays and related costs. It also revealed that Agro-dealers (100 per cent), blenders (74 per cent), retailers (72 per cent), and wholesalers (37 per cent) recognized increased business earnings as one of the most significant tangible benefits in the chain. A well-organized product flow leads to increased sales and revenue generation. Under product flow, seven items that were loaded on the first factor to explain the variance 55% included such statements as reduced cost of production, increased profit, increase returns on investments, reduced waste, avoid over production, and improved timeliness of product movement with alpha value of 0.96, the result implied that the measurement scale is a good indicator of the underlying construct.
    VL  - 11
    IS  - 4
    ER  - 

    Copy | Download

Author Information